
algorithemic design
A REPORT OF CLASS PROGRESS
ARC 504Y
An algorithm is a process of addressing a problem in a finite number of steps. It is an articulation of either a strategic plan for solving a known problem or a stochastic search towards possible solutions. In doing so, it serves as a codification of the problem through a series of finite, consistent, and rational steps. Algorithmic design procedures start from the determination of the problem, and then followed by the analysis of the mathematical and logical methods to solve the problem, and then using computation to translate these methods for computer to understand and execute. (Diagram) In architectural design field, it involves the designation of software programs to generate space and form from the rule-based logic inherent in architectural programs, typologies, building code, and language itself. The role of computer in algorithmic design is no longer a design-aided tool, in the sense of entering, manipulating, or storing designing entities or processes which is already conceptualized in the designer’s mind; instead, it rationalize principles, explore possibilities, and generates results which are not expected in designer’s mind. For architect, algorithmic design enables the role of the designer to shift from an “architecture programming” to “programing architecture”. By doing this, designers can go beyond the mouse, transcending the factory-set limitations of current 3d software. The computation language in architectural field often includes the script for current 3d software, such as Rhino Script, Maya Embedded Language (Mel), and grasshopper.
In 1960s, a need for rationality in the design process was beginning to gain ground, due primarily to the rise of the computer, as an arithmetic and logical device. By introducing set theory, structural analysis, and the theory of computation as a tools for addressing the design problems, quantitative elements or events associated with the design problem could be represented by Boolean variables, that is logical binary variables and later by fuzzy logic, that is, partial truth variables. But the rationalization of design was much more far-reaching. It introduced computers into the design process by suggesting which aspects of the design process are based on rational decisions, some are not. This suggests that design process is open-ended and that it entails frequent changes of mind or changes of constraints and that a computer-based design system should permit them to occur.
Since it is very difficult to simulate a large number of constraints in an architectural design, and the computation involves a large amount of information or information processing, the approach in algorithmic design changed in the 1970s. Rather than competing with, emulating, or replacing designers, the approach was predicted on the brief that they should assist, complement or augment the design process. The machine was introduced as an aid to instruction, as a mediator for the goals and aspirations of the architects by accepting information, manipulating it, and providing useful output. In addition to synthesizing form, computers are also be able to accept and processing geometric information about form. Therefore, it is necessary for architectural design languages to be incented to describe operations on building databases. One pioneering effort in this area is GLIDE, a language which allowed the user to assemble buildings. Another direction of computer-augmented architectural design was the manipulation of architectural forms according to rules. Basic structural and functional elements were assembled to make volumes which, in turn, were assembled to make buildings.
For the last three decades, beginning with Christopher Alexander’s Notes of the Synthesis for Form and Robert Venturi’s Complexity and Contradiction in Architecture and continuing through a plethora of formal studies and computational methods, designers, architects and urban planners have been primarily concerned with increased complexity involved in the design of buildings, urban areas, and cities. The one commons theme is to use computational method to address excessively complex tasks. For the last two decades, beginning with Eisenman’s vision and lynn’s curvilinearity and continuing through an overwhelming plethora of so-called digital design studies, architects have been primarily concerned with the formal architects have been primarily concerned with the formal manifestation of scientific theories using computer as a medium of expression. Instead of using computational theories of the 60s and 70s to explain the complexity of the forms they produced using computers. These practices have attempted to seek for a theoretical foundation of digital phenomena within the scope of classic humanistic methods. i.e. observation, explanation, or interpretation. While such methods are among the fundamental sources of knowledge, they cannot explain the realm of computational phenomena because these extend beyond the sphere of human understanding. Concepts such as randomness, infinity, limit, infinitesimal, or even more elaborate concepts such as complexity, emergence, or recursion are introduced. Start from then, the computer perhaps for the first time, through the invention of the computer, becomes a device originally intended to serve people.
In simple words, algorithmic design means we need to final a rule or principle that is rooted in the nature or in mathematics or a logic, and then use computer code to express that rule and principle and logic, and then apply that coding into the design. Many of the examples I found includes: swarm intelligence, fractals, Cellular automata, 3d voronoi, Hybridization, Synbiosis and ect. The limitation of this technology is that architectural design is super complicated process, and not every part of the design can be very well translated by computation. The other limitation is that the lack of computer knowledge education in architectural school makes coding very difficult for students. The common misunderstanding of algorithmic design is that people would confuse computation with computerization. While computation is the procedure of calculating, i.e. determining something by mathematical or logical methods, computerization is the act of entering, processing or storing information in a computer or computer system. Computerization is about automation, mechanization, digitization, and conversion. Generally, it involves the digitization of entities or processes that are preconceived, predetermined and well defined. In contrast, computation is about exploration of indeterminate, vague, unclear, and often ill-defined process; because it’s exploratory nature, computation aims at emulating or extending the human intellect.
Algorithmic design to some extent changes the role of architect and makes the design process more rational. For example, the old way of study architectural energy performance is that we build a simulation model in the software, and then the software do the calculation and then gave us the analysis of whether the building is energy efficient or not, and then we change the design based on the software’s feedback, and then run the simulation model again until the software gives us positive feedback. But through the algorithmic method, the process will be changed to: we set our design goal and we determine the methods or logic of achieving that goal (sun-angle or façade opening), and then we express that methods with computer-understandable languages and then let the computer generate the results. It is more accurate than human mind and it could replace a massive amount of unnecessary calculating and modeling. A large amount of projects has partially integrated with parametric designs to benefit the building performance. Featured architects includes: BIG, Zaha hadid, Frank Gehry.
OVERVIEW OF vORONOI
A voronoi diagram was discovered through mathematics by Georgy Voronoy and defined as a way of dividing space into a number of regions. We will look at how this mathematical principle is being used in today’s architecture profession. The creation of a voronoi diagram can be outlined in a few simple steps. First, one needs to define a set of points on a given plain. The second step is to draw a line connecting the adjacent points. Third step is to draw perpendicular lines stemming from all of the lines midpoints to the specified boundary. The perpendicular lines connect to form new points. Lastly, the original lines drawn in step two are removed to reveal a new grid called a voronoi diagram. Voronoi can be simply related to the action of cellular growth. When cells grow they extend from the nucleus (voronoi points) maximizing the total area possible. While the surrounding cells are growing simultaneously, the cells are restricted in size because of neighboring cells growth, forcing the cells into a harmonious relationship forming boundary lines (voronoi pentagon shape). The practical meaning of voronoi diagram is that each point has the best control of the pentagon area, thus, any point within the pentagon will always be closer to the original point within the same pentagon than any neighboring pentagon. In other words, “It is the technique that enables the division of such multi-dimensional spaces into subspaces. Its application defines geometric areas equivalent to subspaces by defining several vectors as centres of subspaces”.
Like other naturally simulated structural systems, voronoi is very stable and highly adaptive. The practical means and flexibility of the voronoi diagram allows it to be widely implemented for architects and designers. City planning in architecture may be simplified by assigning the site as a nodal point and then generate the voronoi diagram. This could be used to compare areas covered by different hospitals, or shops, etc. With voronoi diagramming one can easily determine where the nearest shop or hospital and urban planners can study if a certain area needs a new hospital.
Furthermore, both 2d and 3d voronoi diagramming can be transcended into architectural structure systems. For instance, voronoi diagrams can mimic many naturally occurring formations like soap bubbles, sponges or bone cells, which can provide architects with innovative ways to develop building plans or structural systems. Also, by using the voronoi diagramming method it achieves an organic aesthetic quality that viewers have an affinity for.
PROPOSAL
We propose to develop and create a free form that utilizes voronoi diagramming as its sole organizational/structural reasoning. This does not mean that the form must contain a certain function as if it was a building, pavilion etc., but instead demonstrate that we posses a clear understanding of voronoi diagramming. We will use digital modeling tools to produce the “free form” hinting that it could be developed further to be incorporated into architecture. The form could very well progress to contain a clear architectural purpose.
LIMITATION
The first limitation to this project is that there is not a comprehensive list of resources for us to learn and develop from. Since voronoi is a mathematical methodology and it has recently been introduced into architecture design, not much research or implementation has been done by architects. Secondly, the lack of computer programming education constrains our capability of expressing voronoi in parametric modeling. One characteristic of algorithmic design is that the main parameters for any given design can be adjustable through computer programming permitting several iterations to be generated. This allows architects/designers to compare designs and develop them from existing algorithms. Building a voronoi parametric algorithm from the ground up would prove difficult. Thirdly, most of the current examples using voronoi are only conceptualized and only incorporate it as just a portion of the entire design. For example, in National performing Arts Center design by Zaha Hadid studio, the voronoi was only used to study the organization and connection of the building and public space. Even though the overall design appears to be organic, the voronoi concepts are expressed through facade patterns. Most importantly, since the expression of voronoi is very appealing, most projects simply mimic the form without fully considering the benefits that voronoi can have on architectural functions.
APPROACH AND PROPOSAL
Throughout our design progression we will have to grasp an understanding of scripting by using software like grasshopper that would allow us to use/develop algorithms that involve voronoi diagramming. Beginning with 2dimensional surfaces we will be able to effectively grasp how voronoi diagramming reacts in digital modeling space. After, we will transition into 2.5dimensional voronoi dimensions. This means that we would create a 3dimensional shape and then apply a generated 2dimensional voronoi pattern to it. The final and most challenging step involves creating a 3dimensional free form shape that is completely derivative of the processes defined by voronoi diagramming.
Our expected outcomes include a progression of digital models that effectively use voronoi diagramming demonstrating a cognitive understanding of its limitations and capabilities. We will provide an outline of the development progression. Also, we would like to utilize 3d printing to understand the produced geometries physical properties.
APPROACH AND PROPOSAL
I first try to learn how to generate the basic voronoi using the “2d voronoi” and “3d voronoi” battery built in grasshopper. This is the 2d voronoi battery and the input side asks for a points set to generate the voronoi diagram. I first tried to hand draw a set of points in rhino and link it with the input it to the voronoi diagram, and it instantly gives me the voronoi diagram:

Right now since I hand draw all the points, the only way to change the diagram is to redraw all the points and reset to the voronoi. I think that’s not good and I want to make the points controllable. So then I tried a battery called “populate 2d”, it is to randomly generate a set of points constrained by a rectangle. And I use a “rectangle 2 points” battery to generate a rectangle and link to the voronoi. Since the rectangle is controlled by two diagonal points, then I set two points and then I made a slider to make the coordinate of two points adjustable. Here is what I got:

As you might notice, right now the voronoi doesn’t have a boundary. So I am adding an contained box to define the boundary line of voronoi.

Then I hide all the unnecessary components in the view. And try to try to smooth all this polygons into curve line. But when I tried to do so, it gives me error information, which says: insufficient vertices for the curve:

I did some research then I know I need to explode them first and then use all these vertices to generate curve:

And then the next step is to extrude those curves generated by voronoi and make them into 3d. I first extrude the curves by a certain distance, and then also extrude the polygon by the same distance, and then fill the hole of this two shape, then use “solid difference” battery to trim the two shape to get our final 3d voronoi.

3D VORONOI
I use Populate 3d to generate a series of point within a box and then use that point to generate basic 3dvoronoi cells.

Then I try to add a thickness in the form, like what I did in the 2d voronoi. I explode the surface and then offset the surface, unfortunately it doesn’t give me something that I want because the surface are offset in a three dimensional way, but I want them to be offset on the surface:

So I tried another way, using “scale”, and it works fine.

And then I tried to make the curve line controlled by the polygon. I exploded the surface and join the curves and then turn on the control points and use that control point to generate curve lines.

nd then I tried to make planner surface using the curve line I just generated with the voronoi polygon line. But here I come to a problem. Since I have many curve lines and many polygon lines, the computer actually doesn’t know which curve line should make planner surface with which polygon line. That’s the reason why when I tried to use “planner” battery, the computer gives me something crazy like this:

Then I realize I need to categorize the data, but I am not sure how to do that. Right now since I didn’t categorized data, it means that every curve line will make surface with every poly line. That is definitely not right.
Then I use the graft tree to categorize data, and then I make planner surface using the two curves. There is one thing I need to point out. Before I graft the date, I actually first flattern the data. Flattern data can be understood as making a sequence of the date. For example in my case, before I flattern data, let is say I have 10 curve lines and 10 poly lines, and they don’t have a sequence. But after I flattern them, the curve line are listed as 1, 2, 3, 4, 5, 6, 7, 8 , 9, 10 and the poly lines also listed as 1, 2, 3, 4, 5, 6, 7, 8, 9, 10. Then if I don’t use data tree, it means that curve1 will make planner surface with poly line 1, 2, 3, 4, 5, 6, 7, 8, 9. And curve 2 will also make planner surface with poly line 1-10. But after we use data tree, now the data are categorized as group (1,1) (2,2)….. (10,10). And if we make planner surface, that mean curve 1 will make planner surface with polyline 1, curve 2 will make planner surface with polyline 2….ect. Actually in grasshopper graft tree is a very important and confusing concept. But it is a core concept of handling the data.
After this, I Finally get the model which looks like this:

FINAL APPLICATION
Since I already got the base model figured out, now I am thinking of how to make little adjustment for my model so that some of the parameters are adjustable.

The first thing I did is that I add the adjustable box and link it with the populate 3d to control the boundary of the 3d voronoi. This is a highrise version of my voronoi:

Another change I made is that since I need a free-form voronoi and now the voronoi is constrained by a box. So I am planning on reducing some of the points or the surfaces to make it look less irregular. So I add a “random reduce” battery to randomly reduced some of the surfaces that is generated by 3d voronoi battery. Here is what I got:
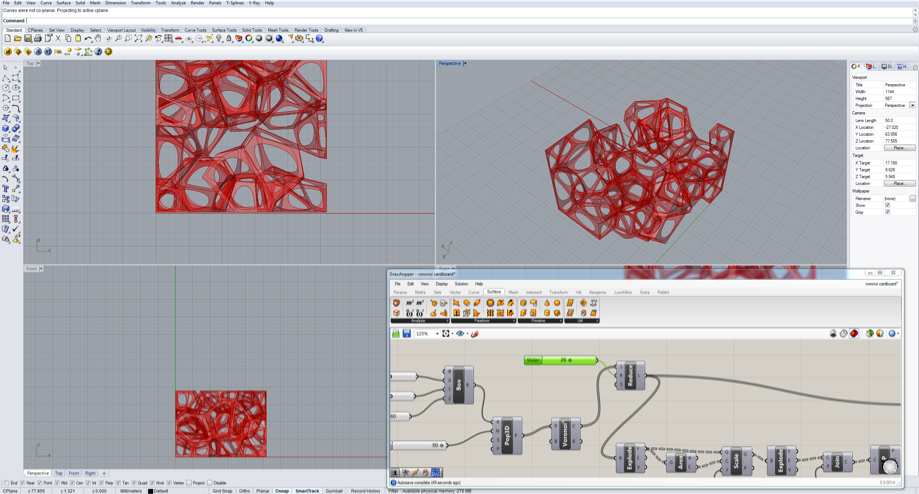
Here is some variations of what I got:

Summary:
3D Voronoi is a new function in Rhino 5. It allows us to divide space based on points constrained in a box. The difficult part about modeling voronoi lies in adding thickness, smoothing surface and ect. My experiment so far still stay in technical level, which means I only study how to modeling voronoi with grasshopper without concerning the apply the voronoi to architecture in order to benefit our design.
PS:
I did a very cool graphic about voronoi diagram (as shown in the cover page). The process of generating it is like this: I first set a group of points to generate voronoi, and then I explode it and use the vertices as the base point to generate another voronoi, and then I use the vertices of the new voronoi as the base point to generate the third voronoi….It getting very interesting since I get to the 5th iteration. And I believe it could be more interesting if more iterations can be done.
To View a list of Voronoi Grasshopper Tutorials please click here.